How It Works · Ontologic™ · Proof of Engine
Every risk platform claims to quantify exposure. Most produce a score. Ontologic™ produces a probability — mathematically derived, node by node, from the actual attack chain. Here is the math.
Ontologic™ · Bayesian Belief Network · Live Example
A Bayesian Belief Network propagates conditional probabilities forward through a causal chain. Each node updates based on its parent. The result at the asset node is not an estimate — it is the mathematically derived posterior probability of compromise, given everything the system knows. That posterior, multiplied by asset value, is your Annualized Loss Expectancy.
Ontologic™ BBN · Insider Threat Scenario · ALE = $425,000 on a $2.5M Asset
Step by step
We start with a prior belief of 41% that Cyber Threat XYB is present in the environment. This is populated from threat intelligence feeds, sector peer data, and EPSS exploit prediction scores — not a guess.
The Conditional Probability Table for CVE-3425 is sourced from CVSS vectors and EPSS data. Given the threat is present, there is a 74% chance it can exploit this vulnerability. Given it is absent, only 8%. Ontologic™ marginalizes across both states.
When the CVE is present, the probability that MFA is compromised rises to 55%. When the CVE is absent, baseline exposure from other attack paths is 10%. Ontologic™ propagates both possibilities forward. Note: this is an insider threat scenario — the System Admin has privileged access to MFA, which is why bypass probability is elevated.
The final node marginalizes across all four combinations of MFA state and Threat state. This is the full Bayesian update — not just the worst case. The result is the true posterior probability that the asset is compromised given everything the model knows.
Annualized Loss Expectancy is the expected annual financial exposure attributable to this specific threat chain. It is directly comparable to insurance premiums, capital reserves, and remediation ROI. It is the number a CFO can budget against — and an insurer can underwrite.
Final Output · Ontologic™
This is not a risk score. It is not red/yellow/green. It is the mathematically derived expected annual financial exposure from this specific threat chain — traceable back to every CPT value, every threat intelligence source, every control effectiveness measurement.
CPT Calibration · Where the numbers come from
The question every sophisticated buyer asks: how do you arrive at the CPT values? The answer is the same one actuaries have used for decades — and the same one that makes Ontologic™ more defensible than any questionnaire-based model.
CVE severity scores, CVSS vectors, and EPSS exploit prediction probabilities provide empirically grounded starting points for threat-to-vulnerability probabilities. When Ontologic™ says P(CVE-3425 | Threat present) = 0.74, that number has a traceable lineage to real exploit data.
NIST, CIS Controls, and insurance actuarial studies publish empirical data on how much specific controls reduce breach probability. MFA bypass rates, firewall efficacy, and patch velocity all have documented effectiveness distributions across attack types.
Verizon DBIR, IBM Cost of a Data Breach, and cyber insurance claims data populate asset-side CPT values and validate ALE outputs against real-world loss distributions. When Ontologic™ outputs $425K on a $2.5M database, that figure is sanity-checked against industry loss data.
For novel threat chains, structured expert elicitation — the same methodology used by actuaries and intelligence analysts — provides calibrated estimates with documented audit trails. Over time, observed outcomes across clients refine CPT values, building a proprietary data asset that compounds in accuracy with every engagement.
Why not FAIR? · Methodology comparison
FAIR is the incumbent standard. It is rigorous and well-documented. But it is a Monte Carlo simulation run on static expert estimates. Ontologic™ is a live inference engine that updates in real time from continuous evidence. The difference matters when the threat landscape changes overnight.
| Dimension | FAIR | Ontologic™ BBN |
|---|---|---|
| Model type | Monte Carlo simulation | Bayesian Belief Network |
| Risk propagation | Linear, manual chains | Non-linear, conditional |
| Input source | Expert interviews | Live scanner + threat intel |
| Update frequency | Quarterly / annual | Real-time inference |
| Output | Loss range estimate | ALE, VaR & Premium Valuation |
| Audit trail | Spreadsheet-based | CPT-traceable per node |
| Audience outputs | Single quantified view | CISO, CFO, Board, Insurer — simultaneous |
Questions & answers
A BBN is a probabilistic graphical model that encodes the conditional relationships between nodes — threat actor, vulnerability, control, and asset. Each node carries a probability that updates based on the state of its parent nodes, propagating belief from threat all the way to financial impact with mathematical rigor. The result is a posterior probability, not a score.
Conditional Probability Tables are populated from four traceable sources: public threat intel (CVE severity, CVSS, EPSS); control effectiveness research from NIST and CIS Controls; loss databases including Verizon DBIR and IBM Cost of a Data Breach; and structured expert elicitation for novel threat chains. Over time, observed client outcomes calibrate values further — building a proprietary data asset that compounds in accuracy.
Risk matrices assign color-coded severity buckets based on subjective likelihood and impact ratings. They do not propagate conditional dependencies — a change in one node does not automatically update downstream nodes. Ontologic™ models risk as non-linear and interconnected, as it actually behaves. The output is a posterior probability and a dollar figure, not a red/yellow/green cell that a board can ignore.
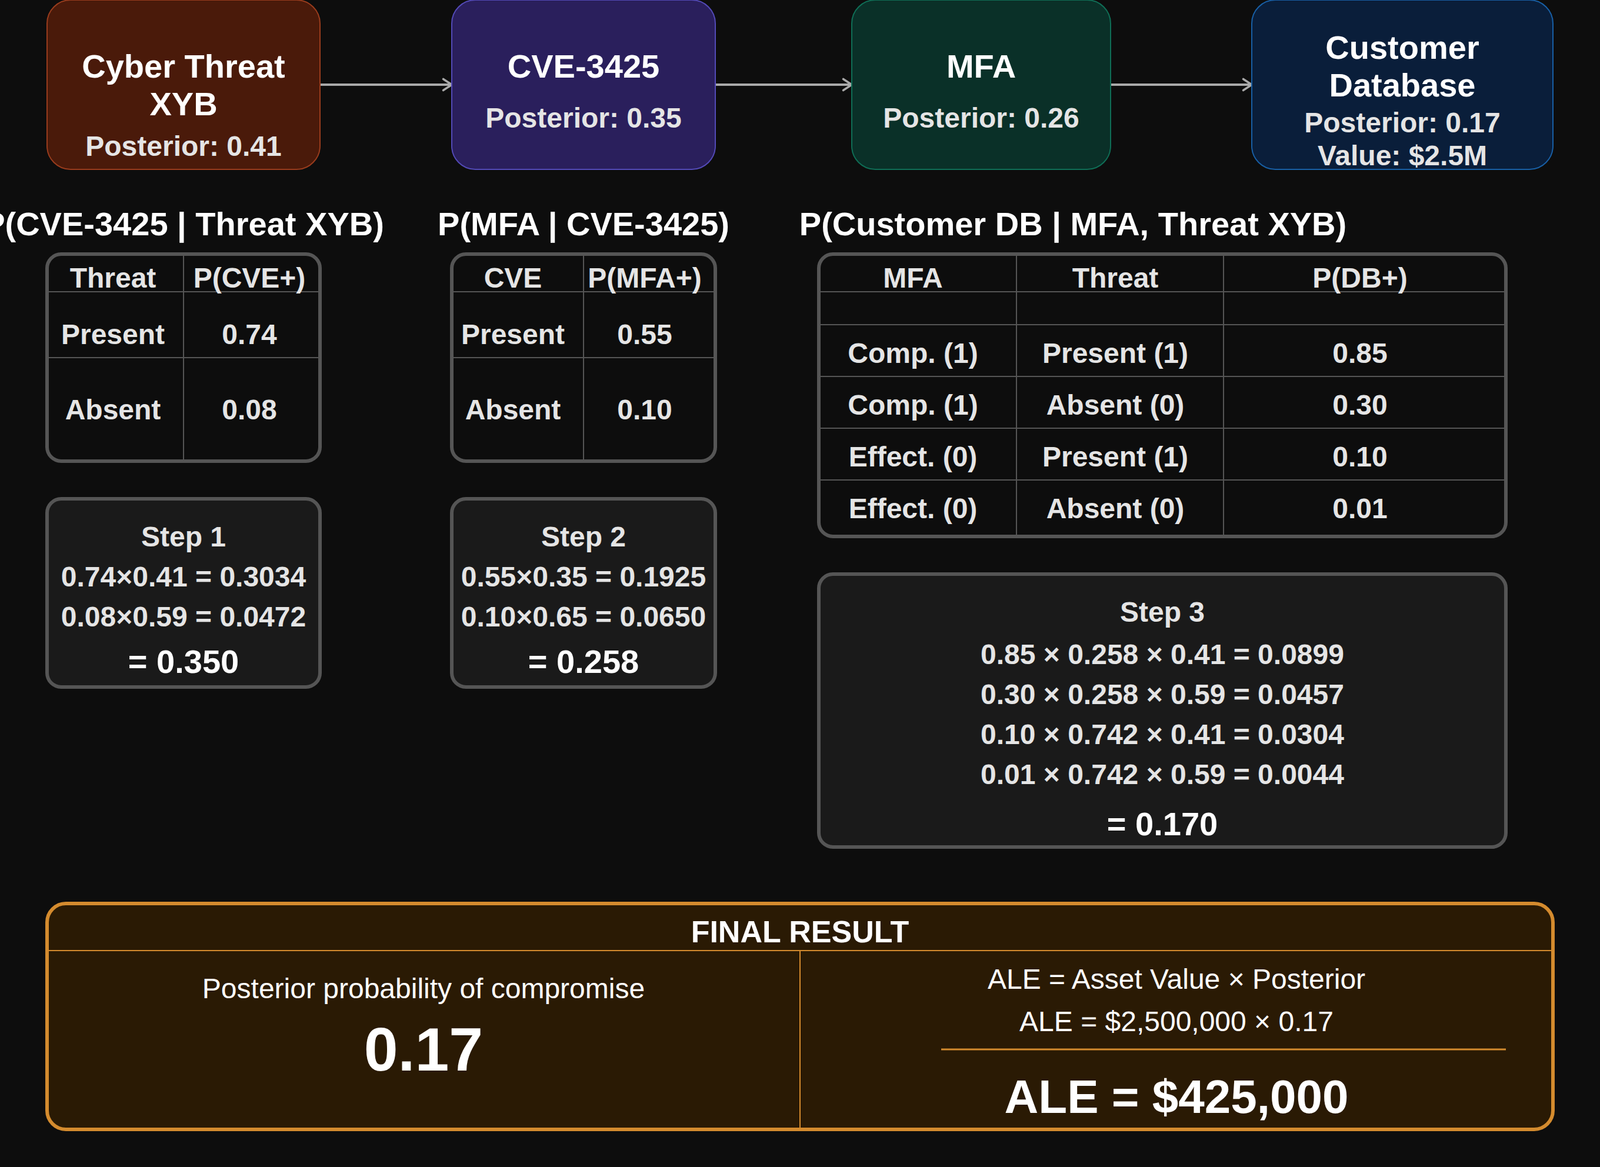
ALE = Asset Value × Posterior Probability of Compromise. This produces the expected annual financial exposure attributable to a specific threat chain — directly comparable to insurance premiums and capital reserve requirements. It is the number a CFO can budget against, a board can hold management accountable for, and an insurer can underwrite against, in a way that CVSS scores and heat maps never could.
No. What you see here is methodology — Bayesian Belief Networks, conditional probability tables, and ALE calculations are well-established public techniques. What is proprietary is the ontology Ontologic™ has built inside those techniques: how threats, vulnerabilities, controls, and assets are classified, related, and weighted at scale; the calibration methodology; and the CPT libraries accumulated across industries and asset classes.
CISOs receive technical risk chain detail and control effectiveness scores. CFOs receive ALE figures tied to business assets and revenue impact. Boards receive portfolio-level exposure summaries in plain language. Insurers receive structured risk data that maps directly to underwriting criteria and coverage gap analysis. One Ontologic™ engine. Four translations. Automatically, in real time.
AiOnTiqRisk · Powered by Ontologic™
Request a risk intelligence briefing and see how Ontologic™ applies this methodology to your organization's actual threat landscape, control posture, and asset values.
Get in Touch
Whether you're a CISO, CFO, board member, or insurer — let's walk through how Ontologic™ maps your specific threat environment to a financial exposure your stakeholders can act on.
Contact: info@aiontiqrisk.com